UCity Family Zone

UCity Family Zone members
Mission:
To promote overall wellbeing, reduce preventable disease, and increase social capital in the people and communities of University City, by coordinating and expanding social determinants of health activities through a Community Organization, University, Business, and Faith-Based Organizations (FBO) partnership.
“An individual’s zip code is a much stronger predictor of their health than their genetic code”
Background – Charlotte:
Charlotte is America’s 17th largest city, is home to 10 percent of North Carolina’s people, but produces 30 percent of its GDP. Although more than 25 percent of Charlotte households make at least $100,000 a year, the impressive income figure masks notable racial disparities:
- 70% of black households make less than $60,000 a year (40% for white households)
- Median income for white families is 86 percent higher than for blacks and Hispanics
- Individual-level poverty has increased 80% since 2000 (from 10 to 18 percent)
- Three times as many African-Americans and Hispanics live in poverty than whites
- Although 25% of children live in poverty, most are minorities – 5 percent of white kids, 36 percent of blacks, and 39 percent of Hispanics.
- High poverty neighborhoods have increased 80% since 2000 (19% to 34%)
- 90% of high poverty areas are in minority neighborhoods
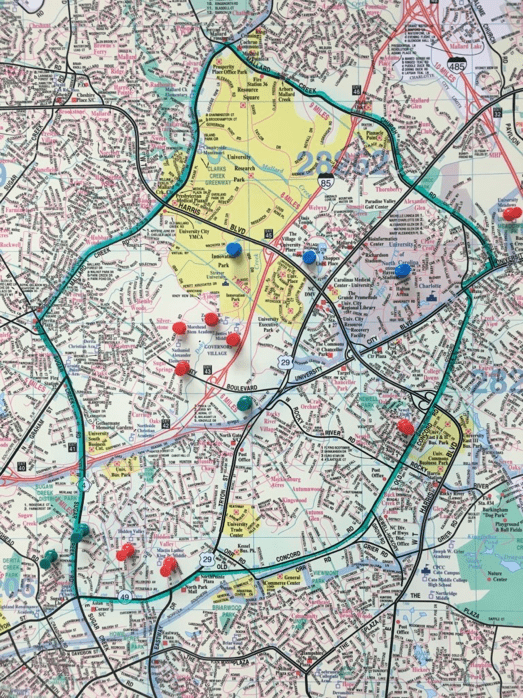
Context – UCity Family Zone:
Living in conditions of poverty is a matter of life and death. Poverty conditions and low levels of social capital affect the way and where people live, their subsequent chance of illness, and their risk of early death. The social and demographic characteristics of the UCity Family Zone (population: 45,426) place the individuals in these neighborhoods at the highest level of poverty-related illness and risk of early death, including:
- Household income – $38,961 (County, $56,854)
- Race and ethnicity – African-American (44%), White (26%), and Latino (19%)
- Age of death – 67 years (County, 71 years)
- Bachelor’s Degree – 30% (County, 42%)
- Test proficiency in Elementary School – 36.6% (County, 51.2%)
- Test proficiency in Middle School – 26.8% (County, 44.4%)
- Test proficiency in High School – 30.2% (County, 50.4%)
- Home ownership – 33% (County, 57%)
- Rental houses – 30% (County, 22%)
- Single Family Housing – 36% (County, 60%)
- Property crime – 61.4 crimes per 1,000 people (County, 31.8)
- Sidewalk availability – 35.5% (County, 42.5%)